Spectra correction utilities
Application of PCA toolset for global analysis of spectral series often requires preparatory treatment of spectra. In particular, it is needed to compensate for changes in the spectral amplitude due to dilution in titration experiments or due to sample compression in pressure perturbation studies. Spectral titration experiments also often need suppression of increasing absorbance of titrant and fluctuations in the turbidity of the sample. For these purposes, SpectraLab includes several spectra correction utilities, which may be found in the "Spectra Correction" section of the Main Menu.
TitCor (Correction on dilution)
This utility is designed for the correction of spectral series on sample dilution in titration experiments. To do so, it multiples each spectrum by the ratio of the sample volume at the moment of scanning to the initial volume of the sample (before titrant additions). It also calculates the titrant concentrations and places them into the Z-column of the SpectraLab spreadsheet. To apply this procedure, the user should place a series of spectra into consecutive locations starting at location one of the SpectraLab spreadsheet. The Z-column should contain the total volume of the titrant solution added for each spectrum of the series. The line-cursor should be placed at the first spectrum of the series (i.e., it should be at location one). After selecting "TitCor (Correction on dilution)" in "Spectra Correction" section of the menu, users will be asked for the total number of spectra to correct (they only need to confirm the number determined automatically), the total volume of the sample (700 Ál by default) and the concentration of the titrant stock solution (20,000 ÁM by default). The use of multiple stocks in one titration experiment is not supported.
Pressure correction
This utility is designed to correct a series of spectra taken in a pressure-perturbation experiment for pressure-dependent compression of the sample. This correction is based on the table of water compressibility published in "The Physics of High Pressure" book by P. W. Bridgman.
Sub (Recursive subtraction of correction traces)
PolyCor (Background suppression)
This is a macro-command for recursive subtraction of a spectrum from a series of spectra starting at location one of the SpectraLab spreadsheet. To do so, users should place the line-cursor at one of the spectra of the series (not necessarily the first one) and select the "Sub..." option in the "Spectra Correction" section of the Main Menu. They will be now asked for the number of spectra to correct and the location of the correction trace.
Optionally, the correction trace may be accompanied by a set of multiplier coefficients to scale it for each spectrum in the series. This scaling option is designed for correcting spectral series on background fluctuations based on the results of PCA procedure. To use it, users should place line-cursor on one of the "Principal vector.." traces in SpectraLab spreadsheet and fit it with a combination of spectral standards and a polynomial using SURFIT module. Now, the polynomial part may be scaled proportionally to the respective eigenvalues and subtracted from both the spectral series and the focused Principal vector by clicking on the "Sub.." option in the "Spectra Correction" section of the Main Menu. The users will be now asked for the number of spectra to correct (default value is determined automatically), the address of the location with the vector of eigenvalues (default value is determined automatically), and the location of the correction trace.
This utility allows for automatic correction of a series of spectra based on the results of Principal Component Analysis. This correction includes both the suppression of absorbance of titrant and correction for the changing turbidity of the sample. To apply this procedure, the user should provide a file with the spectral standards of the compounds of interest (termed "Dynamic Standards") and a file with the spectral standard(s) of the compound (usualy a titrant) whose absorbance should be suppressed from the spectra ("Background Standards"). Optionally, the user can also provide the file termed "Static Standards", where the "Dynamic Standards" are complemented with a prototypical spectrum of a chromophore, which, although present in the system, is not affected by the process under study. Example where "Static Standards" may be needed is a titration of human liver microsomes by P450 substrates. Due to the presence of cytochrome b5, its spectrum (along with the spectral standards of cytochrome P450) should be taken into account for adequate approximation of the absorbance spectra of microsomes. However, the absorbance of cytochrome b5 is not affected by P450 substrates and thus represents a "static contribution" to the spectra.
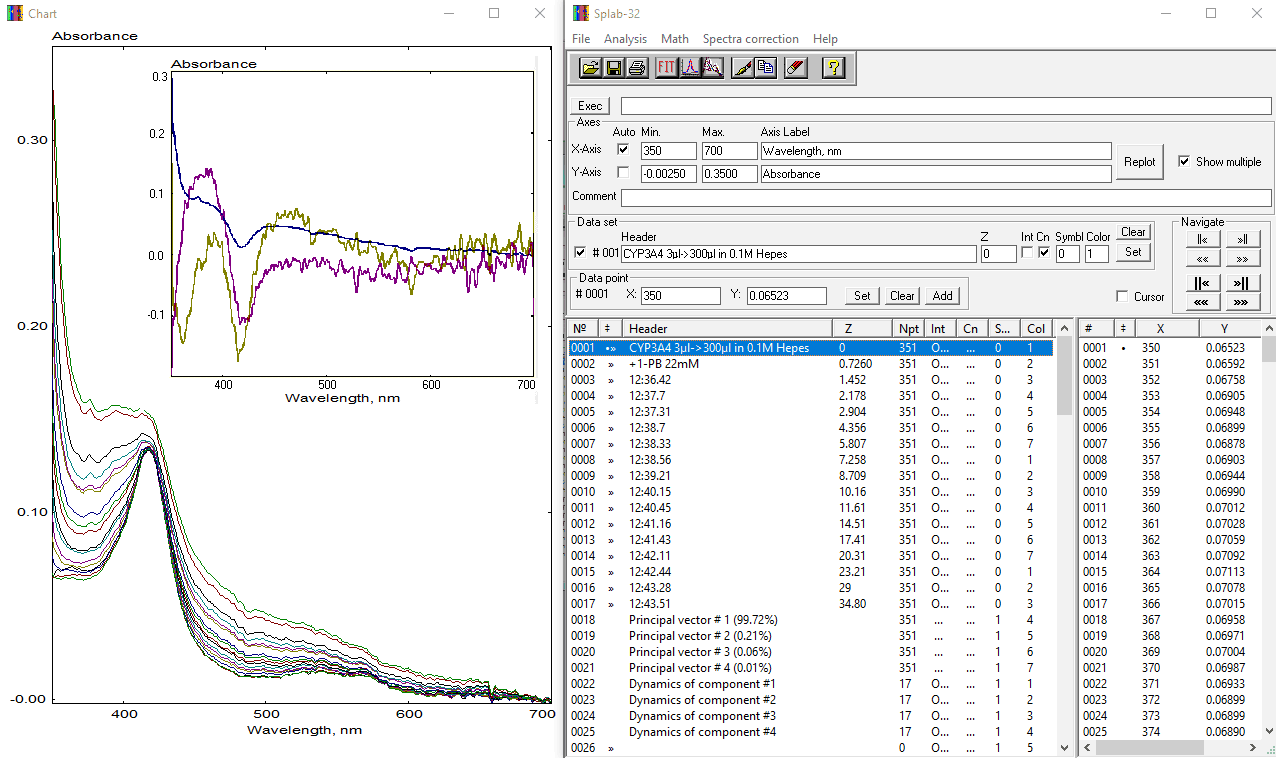
The use of the PolyCor utility is illustrated below by its application to a series of spectra obtained in a titration of purified cytochrome P450 3A4 (CYP3A4) by 1-pyrenebutanol, a type-I CYP3A4 substrate that possesses absorbance bands (at 328, 342 and 374 nm) that overlap with P450 absorbance in the Soret region and complicate the analysis. This dataset may be found in CYP3A4@1PB.SPC file in the "Examples" subfolder of the package. A screenshot below shows the series of spectra under analysis and the results of the first run of the SPAN procedure. Insert in the Chart window shows the first three principal vectors (blue, dark yellow, and magenta for the components 1,2, and 3, respectively).
As seen from the plot, spectral changes upon addition of 1-PB reflect three principal contributions: (1) type-I spectral changes in CYP3A4 due to substrate binding (decrease in absorbance at 418 nm and appearance of the band centered at 396 nm); (2) appearance of the spectral bands of 1-PB at 342 and 374 nm; (3) increase in turbidity (light scattering) at high concentrations of 1-PB, which is poorly soluble in water. The PolyCor procedure may be applied to suppress the changes of the latter two types from the spectra. To do so, the user should place the line-cursor at Principal vector #1 and select thr "PolyCor" option in the "Spectra correction" section of the Main Menu. The following form will appear:
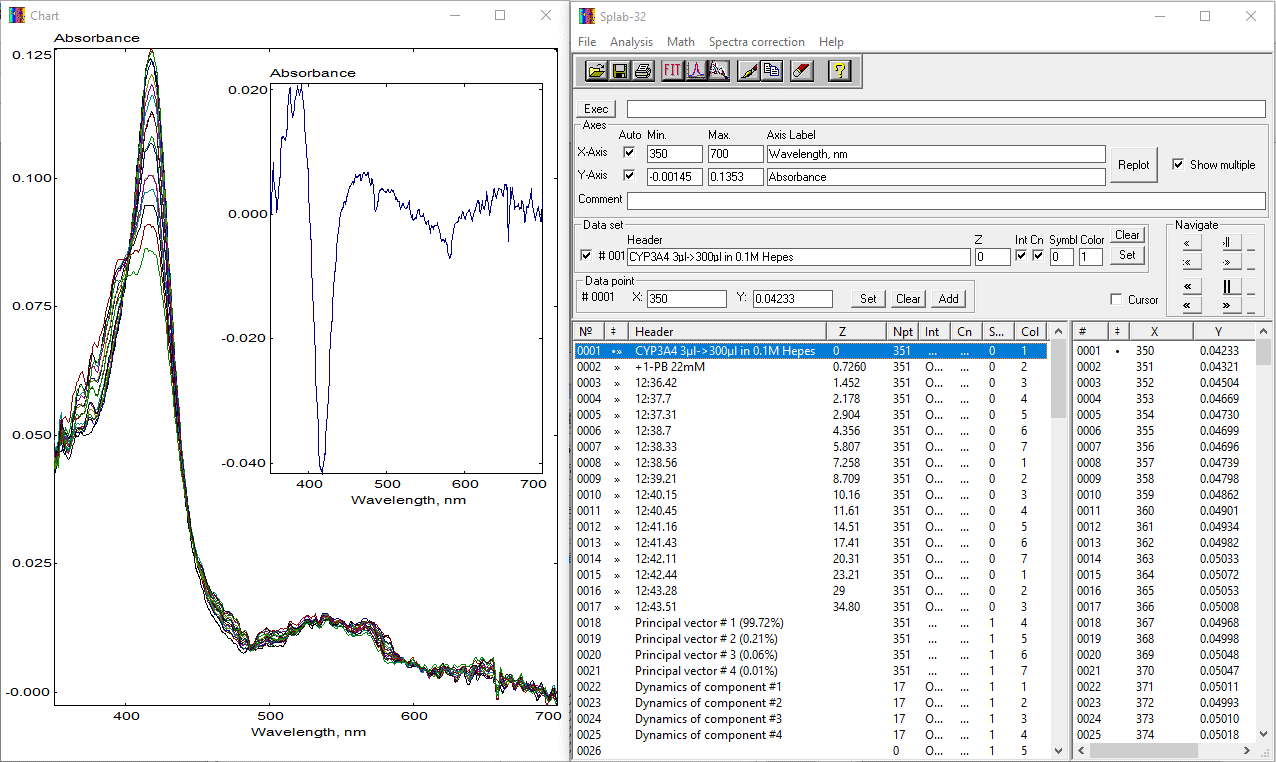
The "Order of polynomial" and "Number of principal components" fields stay for the chosen order of polynomial for baseline correction and the total number of Principal Components (starting from the first) to be used in correction. In the form shown above, we selected the second-order polynomial and four principal components to be considered. The roles of the "Dynamic", "Background" and "Static" spectral standards in the correction process were discussed above. In our case, we selected the CYP3A4.ASC standards as a "Dynamic Target Standards" file and the file PIRBUTAB.ASC as a "Background Standards" file. The latter file contains two spectra of 1-PB absorbance taken in different solvents (water and ethanol) and a differential spectra that depicts the changes in 1-PB absorbance bands at increased concentrations in water. Taken together, these three spectra allow approximating the spectra of 1-PB absorbance both in water and in protein-associated states with high accuracy. Both files used in this example can be found in the "Standards" subfolder of the SpectraLab package. Correction can be started by clicking on the "Run" button. The following screenshot shows the SpectraLab screen after performing the procedure:
The insert shown in the Chart window shows the spectrum of the first principal component after correction. Now, the user can repeat the PCA procedure specifying the file CYP3A4.ASC as a file with spectral standards:
As seen from this screenshot, the traces with Principal vectors and Eigenvalues ("Dynamics of component") are now complemented with a set of newly generated spectral standards and a set of traces reflecting the changes in the concentrations of the compounds under analysis (traces 29 - 32). These four traces are shown in the Chart window, where LS is in green, HS - in blue, P420 - in dark yellow, and the total of all three P450 states is shown in magenta. Now we can divide trace 30 by trace 32 to obtain a dependence of the fractional content of the high-spin state on 1-PB concentration. The resulting curve is S-shaped and reveals homotropic cooperativity in protein-substrate interactions. It may be fitted to the Hill equation model in the CURFIT module. Here is the final result of our analysis:


